Japan—A Macroeconomics Perspective

Japan has seemed unable to thwart its massive and sustained macroeconomics performance deterioration markedly observed during the last few decades (Vogel, 2013). Japan has a national debt of approximately 240 per cent of its GDP, swallowing nearly 25 per cent of its annual budget in interest and principal repayments (BMI, 2016)—This is the highest level of debt among the OECD countries (OECD, 2015). Fast aging population increases public spending and hinders potential growth (OECD, 2015). “The dependency ratio … is the highest among the OECD nations” (MarketLine, 2015, p. 3).
Having drawn a rather gloomy picture, Japan enjoys a high GDP per capita, a high human development index, is technologically one of the most advanced countries in the world (MarketLine, 2015) and owns massive external assets, and has been sustaining a substantial current account surplus—which makes Japan a rare, if not a unique case given its exorbitant fiscal debt (BMI, 2016).
In the remaining of this report, we further discuss five macroeconomics issues about Japan.
Long-term Strengths and Weaknesses of the Macroeconomy
Strengths
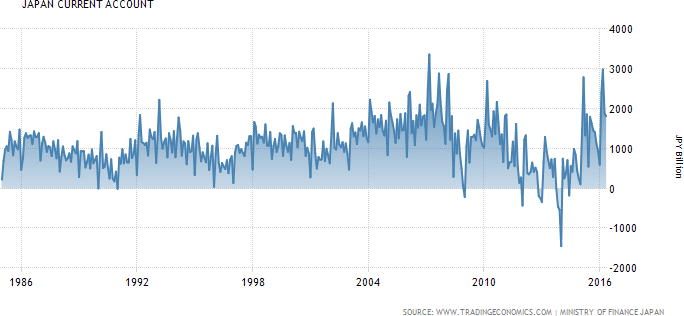
Japan has been maintaining for years a comfortable current account surplus—with the exception of a few anomalies (see Figure 1); and that surplus is forecasted to be sustained in the long-term as depicted in the report of BMI (Japan Country Risk Report - Q2 2016, 2016, p. 13)’s Figure labeled Current Account Balance Forecasts (2014–2025). The main driver of this surplus is the steady income account inflows generated by external assets (BMI, 2016). Japan has accrued a considerable amount of external assets, e.g., the Bank of Japan holds USD 1.25 trillion in reserves (BMI, 2016). “Japan’s net international investment position has risen to 70% of GDP, which is among the highest in the world” (BMI, 2016, p. 14).
Another strength stems from its appealing technological landscape (MarketLine, 2015). Japan is the home of numerous globally-renown high-tech companies in various key areas such as, e.g., telecom, automotive, electronic or heavy engineering (MarketLine, 2015; BMI, 2016).
Weaknesses
The public debt has been steadily growing over the years to reach an alarmingly high level with a gross debt neighboring 240 per cent of the GDP (150 per cent in net terms). More worrisome is the fact that experts anticipate no drastic improvement on the long term, but only a gradual improvement (BMI, 2016) as shown on the figure labeled Fiscal and Public Debt Forecasts, Gross Debt and Fiscal Balance (2007–2025) of the BMI (Japan Country Risk Report - Q2 2016, 2016, p. 12)’s report.
The rapidly ageing population constitutes another source of major concerns. The figure labeled Falling Active Population Ratio Will Be a Major Drag on Savings, see BMI (Japan Country Risk Report - Q2 2016, 2016, p. 19)’s report, presents the gloomy forecast of the demographic profile, whereas the figure labeled Worst Demographics in the Developed World (BMI, 2016, p. 20) shows that Japan has the worst demographic outlook among developed countries. “The working-age population (15–64) is already falling by more than one million per year and is projected to decline by 17% by 2030 and by nearly 40% by 2050” (OECD, 2015, p. 15). A direct consequence is a shortage in labor force; a situation that could be addressed via fostering gender equality and reforming immigration policy (OECD, 2015; BMI, 2016).
This demographic situation hinders the measures to address the massive debt, as social security expenses are likely to further increase in the coming decades (BMI, 2016). The chart in the figure labeled Social Security The Main Drain Government Spending Breakdown, FY2016 Budget of BMI (Japan Country Risk Report - Q2 2016, 2016, p. 11)’s report unambiguously shows that social security already constitutes by far the main expense, followed by the debt; more than 55 per cent of the annual budget is allocated to these two related items.
Trade Position and Competitive Advantage
Trade position
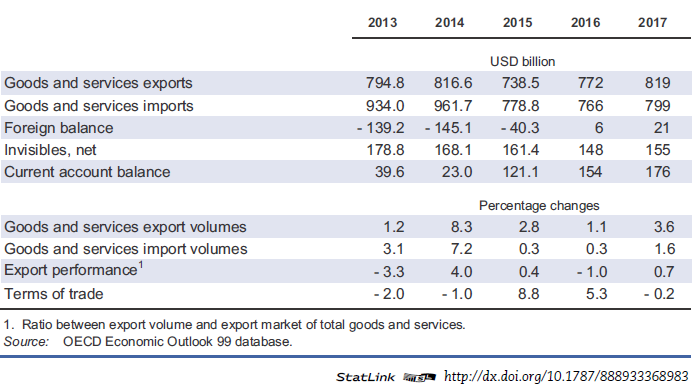
After recently experiencing a substantial trade deficit, caused in large by the aftermath of the Fukushima nuclear crisis (Soble, 2014), Japan has managed to turn its trade balance again to positive (Soble, 2014; BMI, 2016)—see Table 1. Japan is a major energy importer (BMI, 2016), constituting nearly 30 per cent of the total imports (‘Petroleum & Products’ plus ‘LNG’ in the table labeled Main Import and Exports of the BMI (Japan Country Risk Report - Q2 2016, 2016, p. 14)’s report); the imports, and consequently the trade balance, are thus vastly influenced by the prices of oil and gas—the recent low prices of those commodities helped in the return to a positive balance (BMI, 2016).
Competitive advantage
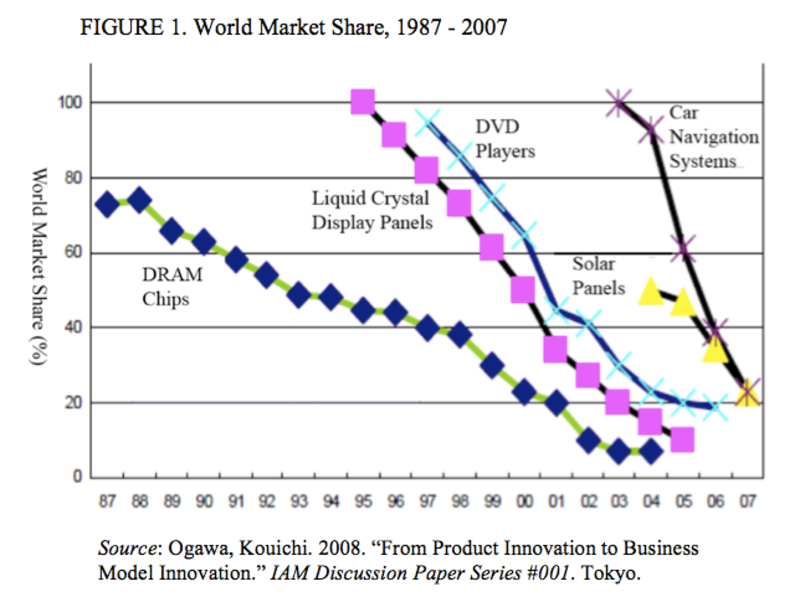
The main export products presented in the table labeled Main Export and Import Partners of the BMI (Japan Country Risk Report - Q2 2016, 2016, p. 14)’s report gives an indication of the competitive advantage of Japan. The automotive industry represents more than 23 per cent of the exports. Toyota, Honda, Nissan, Suzuki, Mazda, Mitsubishi, Subaru, Daihatsu and Yamaha, for example, are all worldwide renowned Japanese firms. Japan has an edge in the electronic industry too with numerous global companies such as the like of Hitachi, NEC, Canon, Fujitsu, Panasonic, Sharp, Sony, Toshiba, Seiko and many others. However, Japan is rapidly losing ground in information and communication technology (ICT) hardware, one of its strongest competitive strengths, which has been eroding at a staggering pace (Vogel, 2013)—as illustrated by Figure 2. Japan is also strong in the chemical industry and does well in the steel industry. Japan has a noticeable presence in the scientific instrumentation realm as well.
Policy Options to Increase Net Exports
It is essential for Japan to increase net exports, as “Japan remains dependent on exports as a driver of growth” (BMI, 2016, p. 8). Table 1 gives an estimation/short term forecast of the net exports (foreign balance)1.
The yen’s buying power has markedly weakened since 2012 (OECD, 2015, fig. 25). Although this has certainly, to a certain measure, contributed to improving net exports—by reducing imports when alternatives exist domestically, the shortage of energy due to the Fukushima nuclear crisis has been pushing the need for importing oil and gas up (Japan’s main imports, see the table labeled Main Import and Exports of the BMI (Japan Country Risk Report - Q2 2016, 2016, p. 14)’s report), negatively impacting the net exports, a phenomenon exacerbated by the considerable depreciation of the yen.
In this section, we discuss possible tactics to increase Japan’s net exports2.
Depreciate the Yen
The yen has a floating exchange rate, an artificial depreciation might constitute a way to increase net exports given a favorable context—e.g., “firms’ pricing strategies; the price elasticities of demand; and firms having sufficient capacity to expand production” (Kitson, 2016, p. 1).
The first Abenomics’ arrow focused on drastic monetary easing and led to yen depreciation (OECD, 2015). However, some observers report a rather deceptive result regarding the positive impact on net exports (Soble, 2014; ECB, 2015; BMI, 2016). BMI (Japan Country Risk Report - Q2 2016, 2016, p. 22) notes that:
[A]rtificially weakening a currency is only beneficial if the reduction in prices received for a country’s exports are more than offset by an increase in export volumes, and the production of exports can be increased with no opportunity cost in terms of reduced production of domestically focused goods. These conditions almost never hold, and in the case of Japan, the weak yen policy has essentially just subsidised the rest of the world at the expense of the domestic economy.
It must be borne in mind that depreciation is a double-edge sword. On the one hand, it improves the competitiveness of Japanese goods abroad; but on the other hand, it increases the cost of foreign products in Japan. In particular, Japan must import a great deal of energy to compensate the shortage engendered by the 2011 earthquake (see the table labeled Main Import and Exports of the BMI (Japan Country Risk Report - Q2 2016, 2016, p. 14)’s report).
We could argue that we are observing a J curve effect (Kitson, 2016, pp. 14 & 15), and that the long-term benefits of the depreciation have yet to be observed. Depreciation alone might not be enough to noticeably improve net exports. Reinforcing competitive advantages (increase exports) and drawing level with “competitive disadvantages” (decrease imports) should help in leveraging the weaker yen.
The third arrow of the Abenomics attempts to achieve those challenging goals with a set of reforms, see Table 3 of the OECD (OECD, 2015, p. 14)’s report. Those reforms should lead to the regain of somewhat eroded competitive advantages (Vogel, 2013), and foster exports.
Besides, Japan is actively addressing the energy crisis. Focus is set on renewable energy and efficiency so as to lower the consumption (DeWit, 2015; OECD, 2015). On the shorter term, nuclear plans shutdowned after the 2011 nuclear accident (OECD, 2015, p. 24) are being certified by new enhanced safety regulations and restarted (Soble, 2014). These should have the effect of reducing energy imports.
Free trade agreements
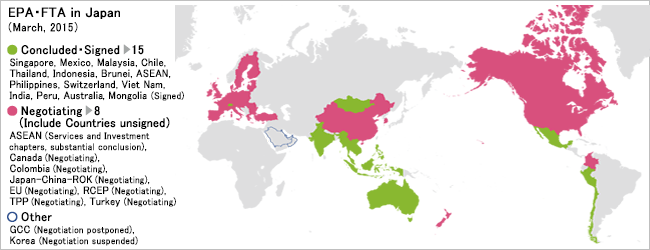
Japanese firms with competitive advantage (see section Trade Position and Competitive Advantage) should gain from free trade agreements, and consequently a surge in exports should follow. Figure 3 depicts the current status. “Japan has signed 15 Economic Partnership Agreements (EPAs) since 2002, they cover less than a quarter of its trade” (OECD, 2015, p. 17) and has just signed the Trans-Pacific Partnership agreement (OECD, 2016). Furthermore, the Japan-EU and the Japan-China-Korea free trade agreements are under negotiation (European Commission, 2016; OECD, 2016).
For instance, considering the EU-Japan Free Trade Agreement (European Commission, 2016), although a narrowing trend is observed, Japan’s net export to EU remains positive—see the table titled Total goods: EU Trade flows and balance, annual data 2005–2015 in the European Commission (European Union, Trade in Goods with Japan, 2016, p. 3)’s report—and thus it is reasonable to believe that voiding the tariff will accentuate this situation and thus improve Japan’s net exports.
To optimize the benefits brought about by those agreements and increase the odds of noticeably improving net exports, it is wise to support tariff protected industries that might otherwise suffer from those agreements (with the consequence of increasing imports, and consequently damaging net exports—in addition to create other domestic problems). Agriculture is especially of concern, tariff on farm goods (especially on rice) is the main financing vehicle of the Producer Support Estimate (OECD, 2015), which “averaged 48% of gross farm receipts in 2013–15” (OECD, 2016), and “consumer spending on agricultural products was 1.8 times what it would have been in the absence of government policies” (OECD, 2015, p. 17). The Abenomics’ third arrow’s ninth reform has been enacted specifically to address this agricultural issue—see Table 3, Reform 9 of the OECD (OECD Economic Surveys JAPAN, 2015, p. 14)’s survey—and “aims to double the income of farmers and farming communities within ten years and double exports by 2020” (OECD, 2015, p. 17).
Impact of the 2007–2008 Financial Crisis and the World Economic Slowdown
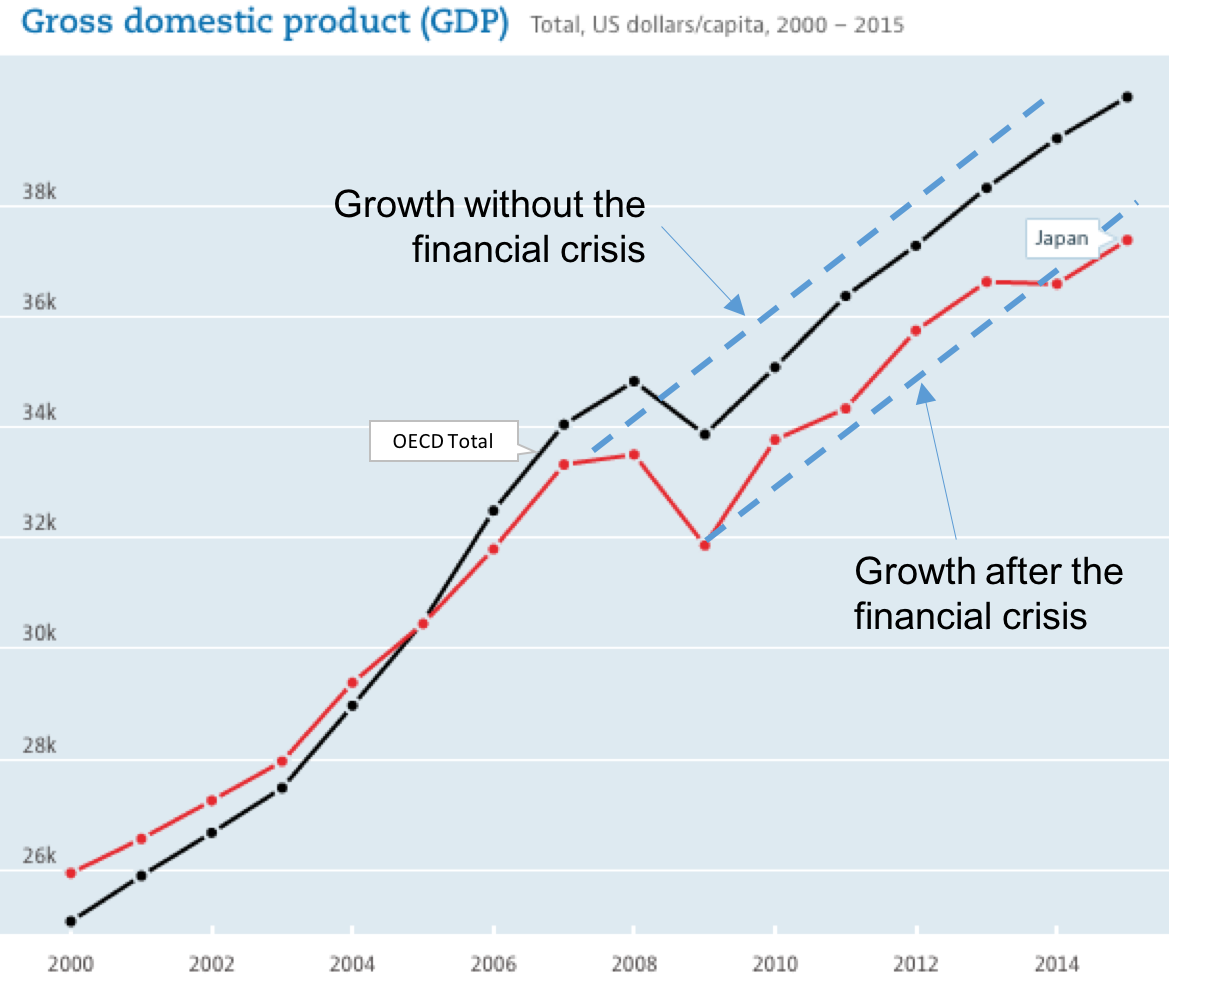
It must be borne in mind that Japan, already in the wake of the 2007–2008 financial crisis (that rapidly translated into an economic crisis), suffered a second major economic crisis due to the cataclysmic tsunami of 2011; and post 2011, Japan must deal with the cumulative effects of those two crises (the figure labeled Heading Lower, Industrial Production Index of the BMI (BMI, 2016, p. 9)’s report shows two corresponding dents). Although the Japanese economy markedly contracted during the 2007–2008 financial crisis, it only marginally contracted during the tsunami-triggered crisis, as depicted in Figure 4—also see the MarketLine (Japan, In-Depth PESTLE Insights, 2015, p. 53)’s report. Furthermore, it is worth noting that Japan was still showing weak economic performance as a result of its 1991 financial crisis (Bosworth, 2015).
At the onset of the financial crisis in 2008, Japan enjoyed a brief respite from the domino effect that was devastating other rich nations (Fackler, 2008; Vogel, 2013; Kawai & Takagi, 2009). But the crisis eventually gravely hit Japan3 (Vollmer & Bebenroth, 2012).
The figure labeled Heading Lower, Industrial Production Index of the BMI (BMI, 2016, p. 9)’s report shows the industrial production index—which “measures the real production output of manufacturing, mining, and utilities” (Wikipedia, 2016, para. 1)—and reveals that the industrial production has been being remarkably poor since the two crises, suggesting that Japan is still struggling in the aftermath of those crises.
Figure 4 depicts the long-term damages inflicted by the crisis on the GDP.
Among the policy responses to recession by the government and the Bank of Japan (Vollmer & Bebenroth, 2012), SMEs (99.7 per cent of the registered firms) have been substantially supported by the government helping them to face the crisis down. The number of bankruptcies has noticeably decreased in Japan since (and during) the two crises (considering the 2011 earthquake), while “bankruptcies increased by an average of 66% in OECD countries over 2007–12” (OECD, 2015, p. 23). However, excessive SMEs support has long-term negative effects for the economy such as hampering the development of market-based financing, keeping undesirable “zombie” firms alive and discouraging firms from expanding. The government should now address those issues by revising its support scheme to SMEs before the burden becomes unbearable (OECD, 2015, p. 23).
Possible Impacts on the Economy if Greece Decides to Withdraw from the Eurozone
A Grexit would most certainly lead to a collapse of the Greek economy with the introduction of a new currency that is expected to rapidly and significantly depreciate (Mercier, 2015; Ernst & Young, 2015). As a direct result, the long-standing trade surplus of Japan would turn to a trade deficit. However, considering the rather minimal level of trade between these two countries (MOFA of Japan, 2016), the implication for the Japanese economy should remain barely noticeable.
There are Japanese corporations established in Greece (MOFA of Japan, 2016); those firms might be exposed to various accounting and tax risks as discussed by Ernst & Young (“Potential Tax Risks from a Greece Exit of the Euro,” 2015). However, due to the small number of concerned firms, it seems unlikely that perceptible repercussions on the Japanese economy would subsequently occur.
Greece would probably default on its colossal national debt after a Grexit (Mercier, 2015). The debt is held mostly by the ECB, the IMF and other European countries (Mercier, 2015; Kottasova, 2015). Those European countries would somewhat suffer from losses, with some impact on their economy. Besides, the entire Eurozone economic climate would be shrouded into vast uncertainty and fear; e.g., it would “reintroduce underlying convertibility risk, reviving financial fragmentation within the monetary union” and “the integrity of the euro zone would come under fresh threat with each episode of political uncertainty within member countries” (Mercier, 2015, p. 4). Consequently, the euro would be gravely struck and its value against the yen would likely plummet; which would dramatically impact trades between Japan and the entire Eurozone, leading to a drop in the Japanese exports to the EU, causing a serious blow to the Japanese economy that relies on those exports—EU 28 constitutes the third export destination, with 10.6 per cent of its total exports; see the table Total Goods: Top trading partners 2015 of the European Commission (European Union, Trade in Goods with Japan, 2016, p. 8)’s report.
The recent Brexit referendum had led to a surge of the yen with various worrisome consequences for Japan (Nagata, 2016). It is reasonable to speculate that a Grexit would trigger a similar upheaval. ■
(Cover photo by Alexandre .L on Unsplash.com)
References
- BMI. (2016). Japan Country Risk Report - Q2 2016. http://goo.gl/ojGjRR
- Bosworth, B. P. (2015). Impact of the Financial Crisis on Long-Term Growth. Center for Retirement Research at Boston College. http://goo.gl/9nujmQ
- DeWit, A. (2015). Japan’s Bid to Become a World Leader in Renewable Energy. The Asia-Pacific Journal | Japan Focus, 13(39), Article 2.
- ECB. (2015). Japan’s recent net export performance. Economic Bulletin, 3.
- Fackler, M. (2008). In Japan, Financial Crisis Is Just a Ripple. The New York Times. http://nyti.ms/1QArRP4
- Kawai, M., & Takagi, S. (2009). Why was Japan Hit So Hard by the Global Financial Crisis? Asian Development Bank Institute, 153. http://goo.gl/WzZ7uw
- Kitson, M. (2016). Macroeconomics—Classic Macroeconomic Issues - Exchange Rates, (slides).
- Kitson, M. (2016). Macroeconomics—Briefing notes for cycle 2 part 3.
- Kottasova, I. (2015). Greek debt crisis: Who has most to lose? http://goo.gl/cLBVI1
- MarketLine. (2015). Japan, In-depth PESTLE insights. ML00002-018/Published 09/2015.
- Mercier, T. (2015). Grexit: Lose-Lose. Flash Recherche, Recherche Economique Groupe—BNP Paribas, 14–15. http://goo.gl/zpkwHF
- Nagata, K. (2016). Yen leaps on referendum surprise; Nikkei tumbles. The Japan Times. http://goo.gl/uvervV
- OECD. (2015). OECD Economic Surveys JAPAN. http://goo.gl/XUDKLw
- OECD. (2016). OECD Economic Outlook, Volume 2016 Issue 1. http://goo.gl/ToAhij
- OECD. (2016). Producer and Consumer Support Estimates database. http://goo.gl/xp9HYL
- Soble, J. (2014). Japan’s record trade deficit raises fresh doubts about Abenomics. Financial Times. http://on.ft.com/1z6ExWM
- Soble, J. (2014). Japan trade deficit narrows as exports rise. Financial Times. http://on.ft.com/1AyjtZZ
- Vogel, S. K. (2013). Japan’s Information Technology Challenge. In D. Breznitz & J. Zysman (Eds.), The Third Globalization: Can Wealthy Nations Stay Rich in the Twenty-First Century? (pp. 350–371). Oxford University Press.
- Vogel, S. K. (2013). What Ever Happened to Japanese Electronics?: A World Economy Perspective. The Asia-Pacific Journal | Japan Focus, 11(45), Article 2.
- Vollmer, U., & Bebenroth, R. (2012). The Financial Crisis in Japan: Causes and Policy Reactions by the Bank of Japan. The European Journal of Comparative Economics, 9(1), 51–77.
- Wikipedia. (2016). Industrial production index—Wikipedia, The Free Encyclopedia. https://goo.gl/O0gish
- Ernst & Young. (2015). Potential tax risks from a Greece exit of the Euro. Japan Tax Alert—Ernst & Young Tax Co. http://goo.gl/aqovoc
- European Commission. (2016). Japan - Trade. http://goo.gl/B4ELzo
- European Commission. (2016). European Union, Trade in goods with Japan. http://goo.gl/uC3Hd4
- MOFA of Japan. (2016). Japan–Greece Relations (Overview)—Ministry of Foreign Affairs of Japan. http://goo.gl/lh0zfz
-
Other observers believe that the net exports will remain negative and even deteriorate on the long term, see, e.g., the table labeled Net Exports Forecasts from the BMI (Japan Country Risk Report - Q2 2016, 2016, p. 10)’s report. ↩
-
Since 2012 the so-called Abenomics (Wikipedia, 2016) has been attempting to boost growth (the third arrow), and therefore Japan has been/is already implementing measures towards improving net exports (OECD, 2015); meaning that we can already observe some preliminary results of some policy options. ↩
-
Kawai and Takagi (“Why Was Japan Hit So Hard by the Global Financial Crisis?,” 2009) attempt to explain some of the factors that made the crisis especially painful for Japan. ↩